Hey there, crypto enthusiasts! If you’re keeping an eye on the decentralized finance (DeFi) world, you’ve probably heard of DeFiLlama, a go-to platform for tracking total value locked (TVL) across various blockchain protocols. Recently, they dropped an eye-catching update on X that’s got everyone talking—a TVL market share heatmap showcasing the latest trends as of July 2025. Let’s break it down and see what’s cooking in the DeFi kitchen!
What’s the Heatmap All About?
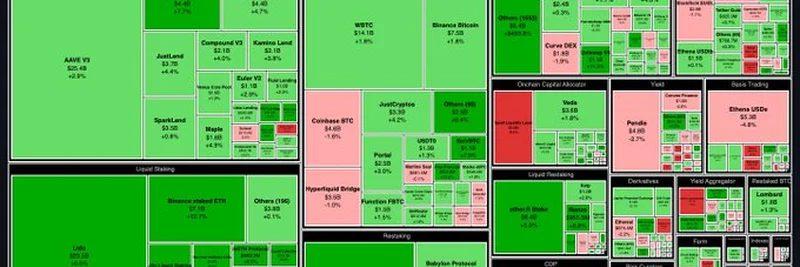
The heatmap, shared by DeFiLlama on July 2, 2025, is a colorful visual feast that breaks down the TVL distribution across different DeFi categories. Think of TVL as the total amount of money (in crypto) locked into these protocols—kind of like the lifeblood of the DeFi ecosystem. The heatmap highlights the top 20 categories plus an "Others" section, with each block’s size and color telling a story.
- Green blocks? Those are the winners, showing growth in TVL.
- Red blocks? They indicate a dip in value.
- The bigger the block, the more TVL it holds.
Lending Leads the Pack
Right off the bat, the "Lending" category steals the spotlight with a massive $25.4B TVL, making up a huge chunk of the pie. Protocols like Aave V3 (+2.9%) and JustLend (+4.4%) are shining stars here, showing steady growth. This isn’t surprising—lending is a cornerstone of DeFi, letting users borrow and lend crypto without banks. The heatmap also shows other players like Compound V3 (+4.0%) and Kamino Lend (+3.3%), proving this category’s dominance.
Liquid Staking and Bridges Join the Party
Next up, "Liquid Staking" and "Bridge" categories are flexing their muscles. Liquid staking—where you stake your crypto and get a token you can use elsewhere—boasts $23.5B, with Lido (+6.0%) and Binance Staked ETH (+12.7%) leading the charge. This growth makes sense since liquid staking lets you earn rewards while keeping your assets flexible for trading or lending.
Bridges, which help move assets between blockchains, hold $14.1B, with Wormhole at $3.3B (+4.2%) and Binance Bridge at $7.5B (+1.8%). These bridges are crucial as the DeFi space expands across multiple chains, making cross-chain compatibility a hot topic.
Green Dominates, but Red Flags Exist
Overall, the heatmap is mostly green, signaling a healthy week for DeFi. Categories like Restaking (+8.7%) and Yield (+1.3%) are seeing solid gains. But not everything’s rosy—some protocols, like Veda (-4.8%) in the "Onchain Capital Allocator" category, are in the red, hinting at potential challenges or market shifts.
Why This Matters for Meme Token Fans
You might be wondering, “What’s this got to do with meme tokens?” At Meme Insider, we’re all about connecting the dots. Many meme tokens thrive in DeFi ecosystems, leveraging lending, staking, and bridges to boost liquidity and hype. Understanding TVL trends can help you spot where meme token projects might pop up next or which platforms could support their growth. For instance, a booming lending category could mean more opportunities for meme token-backed loans!
What’s Next?
This heatmap is a snapshot of July 2025’s DeFi landscape, but the space moves fast. Keep an eye on DeFiLlama for real-time updates, and dive into their dashboards to explore protocols like Moai Finance V3 or RangoExchange, which they’ve recently started tracking. Whether you’re a blockchain pro or just dipping your toes in, this data is gold for making informed moves.
So, what do you think about these trends? Drop your thoughts in the comments, and let’s chat about how they might shape the meme token world! 🚀

