If you've been following the crypto space, you know that Bitcoin's price movements often feel like a rollercoaster. But according to a recent thread on X by @Sykodelic_, we're not heading into a repeat of the 2021 peak and subsequent crash. Instead, he argues that Bitcoin and the broader market are poised for expansion, driven by global liquidity and economic cycles. Let's break this down step by step, especially for those new to these concepts, and see what it means for meme tokens and the blockchain world.
Understanding Bitcoin as a Liquidity Vessel
First off, Sykodelic_ emphasizes that Bitcoin isn't just riding on a fixed four-year halving cycle—it's more like a sponge soaking up global liquidity. Liquidity here refers to how much money is flowing through the economy, influenced by things like interest rates and central bank policies. In bull markets, easy money fuels risk-taking, pushing assets like BTC higher. But right now, we're in a unique spot compared to 2021.
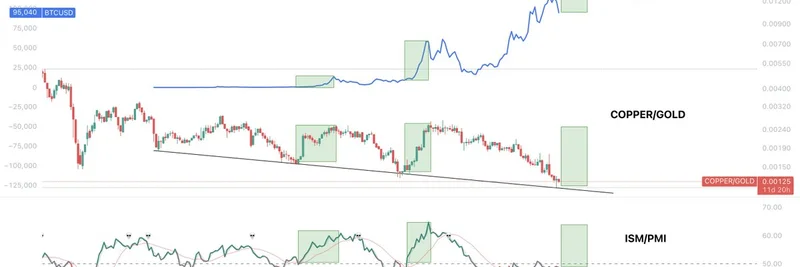
He points to a chart that overlays Bitcoin's price with two key economic indicators: the Copper/Gold ratio and the ISM/PMI index. These aren't your typical crypto metrics, but they paint a clear picture of the broader economy.
Decoding the Copper/Gold Ratio
The Copper/Gold ratio is a classic economic gauge. Copper, often called "Dr. Copper," is essential for construction, electronics, and manufacturing—basically, anything that screams economic growth. When demand for copper rises, it signals expansion because businesses are building and investing more.
Gold, on the other hand, is the safe-haven asset people flock to during uncertainty. It's like the financial world's comfort blanket. So, when the Copper/Gold ratio climbs, it means copper is outperforming gold, pointing to a risk-on environment where the economy is humming along.
As shown in the chart, Bitcoin's ups and downs have historically mirrored this ratio. During growth phases, BTC surges; in contractions, it dips. Right now, the ratio is bottoming out, suggesting we're on the cusp of an upturn—not the top like in 2021.
The Role of ISM/PMI in Economic Health
Next up is the ISM/PMI, which stands for Institute for Supply Management's Purchasing Managers' Index. Think of it as a monthly report card on manufacturing activity. A reading above 50 indicates expansion, below 50 means contraction.
We're currently in the longest contraction period ever recorded, with PMI grinding below 50. But it's starting to edge upward, hinting at recovery. Historically, when PMI crosses back over 50, it coincides with rallies in Copper/Gold and, you guessed it, Bitcoin.
In 2021, both indicators were peaking, signaling the end of the expansion phase and the start of a downturn. Today, they're bottoming, aligning with the end of a prolonged liquidity squeeze and the beginning of easing policies.
Why This Matters for Crypto and Meme Tokens
So, why isn't Bitcoin pumping wildly like in previous bulls? Sykodelic_ attributes it to the contracting global environment, offset only by institutional and government adoption—think ETFs and nation-state buys. Altcoins and meme tokens have suffered more because they thrive on retail hype, which needs that liquidity flood.
But here's the optimistic flip: as PMI ticks over 50 and Copper/Gold rebounds, we could see a true expansion phase kick in. This isn't 2021's peak; it's more like the early stages of a new cycle. For meme token enthusiasts, this could mean renewed interest and volatility, as easier money flows into speculative assets.
Of course, nothing's guaranteed in crypto, but these macro indicators provide a solid framework beyond just chart lines and halving hype. If you're holding bags or eyeing entries, keep an eye on these real-world signals—they might just signal the next big move.
For more insights, check out the full thread on X and join discussions in communities like Sykodelic_'s Discord. Stay informed, and remember, in blockchain, knowledge is your best asset.