In the ever-evolving DeFi landscape, tools that provide clear insights into protocol performance across multiple blockchains are game-changers. DefiLlama, a leading platform for transparent DeFi data, has just enhanced its Chart Builder with a new grouping feature. This allows users to break down metrics like fees, TVL, or volume by chain, offering a granular view of where a protocol's activity is concentrated.
The team demonstrated this update using Uniswap, one of the most popular decentralized exchanges (DEXs) for swapping tokens, including countless meme coins. By toggling between absolute values and market share percentages, you can spot trends in growth and adoption. Let's dive into the visuals they shared.
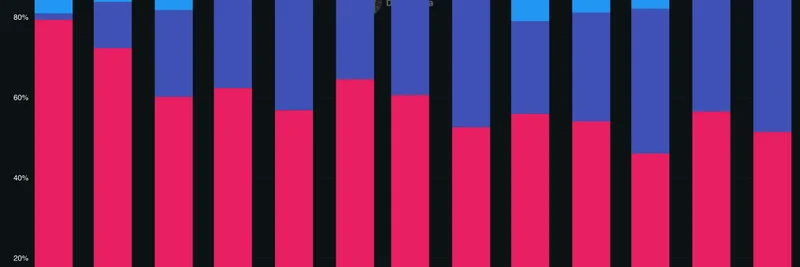
Market Share View: How Fees Are Distributed Percentage-Wise
This stacked bar chart shows the percentage of total Uniswap fees generated by each chain over time, from September 2024 to September 2025.
Ethereum starts strong, claiming nearly 100% in late 2024, but its dominance wanes as Layer 2 solutions ramp up. Base emerges as a powerhouse, capturing a significant portion by mid-2025—likely fueled by its low-cost environment that's perfect for high-volume meme token trades. Other chains like Arbitrum, BSC, and Polygon also gain traction, reflecting the broader shift toward multi-chain DeFi.
Absolute Fees View: Raw USD Numbers Tell the Growth Story
Switching to absolute fees in USD, the chart highlights overall fee generation without percentages, making it easier to see total revenue spikes.
Fees peak around November 2024 at over $150 million, dip in early 2025, and fluctuate with market cycles, hitting another high in May before tapering off. The diversification across chains like Base and Arbitrum underscores how these networks are driving real economic activity, often through viral meme token launches and trading frenzies.
Implications for Meme Token Enthusiasts
For those in the meme token space, this tool is a treasure trove. Meme coins thrive on liquidity and low fees, and chains like Base have become hotspots due to their efficiency. By analyzing Uniswap's fee data via DefiLlama's Chart Builder, traders can identify emerging chains where meme activity might explode next. It's not just about Ethereum anymore—L2s are where the action is, reducing gas costs and enabling more accessible pumps.
This update empowers blockchain practitioners to make data-driven decisions, whether you're a developer building on Uniswap or a trader hunting the next big meme. Check out the full feature on DefiLlama의 Chart Builder and see the original post on X.
Stay tuned to Meme Insider for more breakdowns on DeFi tools that impact meme ecosystems!