In the fast-paced world of crypto, where meme coins can skyrocket or plummet overnight, understanding broader market dynamics is key. Recently, a thread from @CredibleCrypto on X caught our eye at Meme Insider. He revisited his spot-on call during the 2020 COVID crash, emphasizing why market structure trumps simple percentage drawdowns. While focused on Bitcoin, these principles can supercharge your approach to meme tokens. Let's break it down.
The Backstory: Bitcoin's Wild Ride in 2020
It all started with a quote from @Altcoinist_com, praising CredibleCrypto for nailing Bitcoin's bottom during the pandemic panic. Bears were screaming for $1,200 or even $125 BTC, but CredibleCrypto, using Elliott Wave theory, spotted a higher low at around $3,700. He predicted a rebound to new highs—and boy, was he right. BTC surged over 20x to above $60,000.
Elliott Wave theory, in simple terms, is a technical analysis method that predicts price movements by identifying recurring wave patterns in market psychology. Think of it as waves of optimism and pessimism driving prices up and down in predictable cycles.
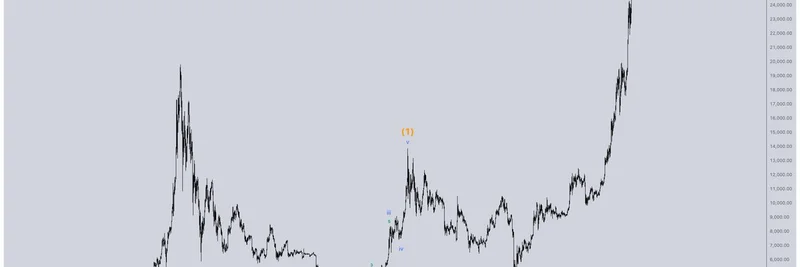
In the chart above, you see one of Bitcoin's cleanest impulses—a strong upward move—from $3,000 to $14,000. Then came a brutal retracement, nearly 100%, but crucially, it held above the impulse's origin (that red line at $3,111.93). This "higher low" signaled the bull run wasn't over.
The Key Insight: Structure Over Percentages
CredibleCrypto stresses that drawdown percentages—like a 50% drop—lack context without looking at market structure. A big dip might just be a correction if key support levels hold. In 2020, despite the crash, the invalidation point (around $3,100) wasn't breached, so he stayed bullish.
He shared this chart from back then, labeling it as an expanded flat correction with a perfect 1:1 extension—technical jargon for a pattern where prices correct sharply but set up for the next leg up.
And to prove his conviction, here's the actual tweet he posted on March 13, 2020, calling for $14,000 before any further drop to $3,000.
Applying This to Meme Coins Today
Meme tokens like Dogecoin or newer ones on Solana often mirror Bitcoin's volatility but amp it up with community hype and rapid pumps. The lesson? Don't panic-sell on big drawdowns. Instead, map out your meme coin's market structure:
- Identify Impulses: Look for strong, uninterrupted upward moves—these are your bullish signals.
- Watch for Higher Lows: If a dip holds above previous key levels, it could be a buying opportunity, not the end.
- Use Invalidation Points: Set clear lines where your thesis breaks, like CredibleCrypto's $3,100 for BTC.
Of course, no system is foolproof—CredibleCrypto admits his framework works 9/10 times. Meme coins add extra risks with lower liquidity and pump-and-dump schemes, so always DYOR and manage risk.
This thread originally posted here is a goldmine for blockchain practitioners. At Meme Insider, we're all about building that knowledge base to help you thrive in crypto. What patterns are you seeing in your favorite meme tokens? Share in the comments!
For more on crypto technical analysis and meme coin trends, check out our knowledge base. Stay tuned for updates!